26.9.08

Open account in Marketiva

. 26.9.08
1 comments

Before you open a new account, you must to check marketiva price list and payment option and to read and understand the following policies marketiva adheres to regarding payment and anti money laundering processes.

Price ListPayment OptionPayment PolicyAnti Money Laundering

One person can open one account only. In case marketiva administration system detects there are multiple accounts registered by the same person, such account will be suspended an the account holders will be required to provide supporting documentation. This policy was introduced as a response to many related misuses maketiva experienced in the past.

Open a new account in Marketiva

1. Click the banner first.

The front page of Marketiva


2. Click the tab "Open Account" and then a register form will be apear.
Please fill out the registration form.

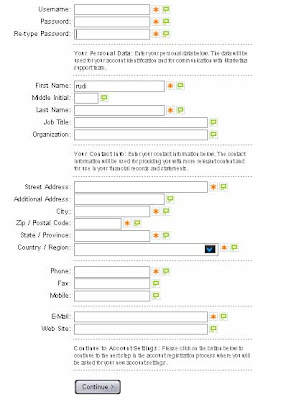
After you finish fill out the registration form, click "Continue". Please fill out form below.

"User Template", choose Standard Setup.
"Coupon", we have some coupon here. You must only choose one.
PKHRCX5FO5,YUILCPJ79R,L51OEZSMUQ,NWKFOGVC0B,13UFB4IR5D,2FULJ5LDCM,
8QXUKEJUT7,EVCSKJJ67S,LHA5SQWA0Q,QEB1WEHS3K,K97H6NJAZD,V7XMZOBNJK, SNTJJ0L99C,W5R4MTWA9D,O99GL5FWKS,5FVKD2EQLR,WFDKM02Z07,A9USK79BJH, LT91P9TY1C,FFPO1Y0MS1,4AW54SQR32,IJWDKV80UD,GOIIKI76YB,NU4VD48TFV, K8DKKDQGWI,1OMOZB7MUY,L4M4OW98RY,U53LG32431,MXSCRWCRKW,
NW2BWD0YOS

Continue to terms acceptance, click Next.

check box service aggreement, and then click Finish

3. Verify your ID
After finish registration, you have to identify your self by upload some of your ID. (eq. lisence, identity card, passport). Remember just JPEG format.
Click here to direct link
  • Log on. Use your username and password.
  • Click tab "service", and then click "Identify Yourself"


4. Download software streamster marketiva. Click here

Read More..... »»

Marketiva

.
1 comments

What is Marketiva ?

With more than 520,000 serviced users, 310,000 unique and live trading accounts, and more than 3.7 million live orders executed each month, Marketiva is one of the most popular over the counter market makers in the world.
You Receive $5.00 FREE Money to Try Live Forex Trading today. Marketiva Start Trading Forex Today With as Little as $1 Dollar. If you ever thought about Forex Trading you will never find a better place to learn than right here at Marketiva plus they pay you $5.00 real money just to open your account and another $10.000 virtual money to practice with.Marketiva are a Swiss company based in Lausanne and have recently launched their Forex Trading Platform fully integrated with e-currencies. It is a state of the art platform with many advanced features but really user friendly for beginners with 24 hour live support via their onboard chat room.

So join marketiva , you got nothing to loose and lots to gain. Spend some time on the website and you just might surprise yourself by how much you learn and in six months or a year from now you could be trading for a living.Enjoy Forex Trading in Marketiva, doing Trade from Home or Office. Earn income Us $ 50 - $ 100 per day from Easy Trading, It’s Fun !Download Streamster Software now, be successful trader in the forex market. Visit Maketiva website, Open Account Today !

Forex online trading a trade system according to online that is via internet technology ware, where with this system unnecessary investor again come or busy phone broker office, because enough with internet access now can easily you can, you can sit at home while enjoy coffee dish and fiddle around with family, at warnet or cafe that has internet service hotspot and other . All price informations and investment execution can be done, where and any time whilst you can relate to the this illusion world. Thereby forex online trading this have come to trend alternative easy investment and cheap at this information technology century.

Excess other from forex online trading that is leverage and two ways opportunity, where with existence leverage investor only need investasi capital equal 4 – 10 % from investment total that need, and two ways opportunity that is possibility that can get advantage when strong currency exchange rate and or weakens, besides investor also earns actively controls x'self its (the invesment risk becomes as minimum as possible).

next surplus explanation from forex online trading:

Small capital laverage
. With system existence margin make possible investors to do in big volume with little relative capital.

Two ways opportunity
.
Transaction can be done with two directions, buy or will sell beforehand based on predictions rates will rise or go down (trend).
for example moment that is you take position buy and obvious currency price movement show trend rise significant, so you can take profit from price difference buy with close position buy you with sell (take profit), so also on the contrary when do you take position sell formerly and then currency price movement experience trend depreciation, so you also can take profit with close position sell you with (take profit).

buy at low price, sell at a stiff price = profit
sell at a stiff price, buy at low price = profit

High liquidity
capital which in planting at the times can easily be liquefied to return, a lot of fund liquefaction method and fund increasing dependings from company forex.

Flexible and no time management constribution necessary
24 clocks a day begin from monday until friday, where and any time you can do transaction provided you are connections with internet.

• 04.30 wib: new zealant exchange
• 05.30 wib: sydney stock exchange
• 07.00 wib: tokyo stock exchange (market open)
• 08.45 wib: hong kong stock exchange
• 09.00 wib: singapore stock exchange
• 09.30 wib: jakarta stock exchange
• 14.30 wib: european exchange and london exchange
• 19.30 wib: new york stock exchange
• 04.00 wib: new york stock exchange (market close)
this investment is bot many sizes time for the management is compared with other effort.

Risk management and limited risk
You can manage self existing risk. Some ways to restrain your finances at the time of does trading at marketiva, among others:

• averaging
• stoploss and limit
• cut loss
• switching

No man power cost and no taxation
Doesn't need cost for labour.
This trade is done globally between world finance centre with involve world principal bank as principal executor from this transaction. This effort blooms in such a way fast in period lately with growth level around 30 percents per year it. This currency trade is one of [the] trade effort rotation volume and biggest the money circulation at world and in this time number around usd 1.5 trilliun every the day. Rotation volume magnitude form a market has perfect rivalry for no one even also participant in this trade has function as price determinant.

About Forex online trading

Marketiva company service forex trading online from switzerland, europe. The services enough popular fast at internet. Every member can direct do trading with beginning capital enough 1 or even cost less, even to begin at marketiva this you be be given capital as big as 5 (real money) that can direct you use to live trading. After you get profit enough so you can interesting it to your bill.

Besides 5 as beginning capital, you also get virtual money as big as us$10,000. This virtual money is tool for you to learn simulation trading, so that you easier realizes manner analyzes price movement, sales manner (transaction), read chart, and everything that trading forex. After you have felted self confidence so you can direct use money 5 that you have got according to free that to do live trading.

As a member marketiva, you also will get software trading, that is streamster according to free and can at download a moment after you are registered as member. Software streamster this platform trading online marketiva that used to transaction currency sales according to online, observe price movement according to realtime and economic news update at internet

Superiority marketiva:

  • bonuses 5 cash, can direct be used to live trading
  • spread begin from 3 pips for pair eur/usd
  • trading begin from 1% margin
  • virtual demo and live trading with 1 account
  • latest economic news
  • alerts on market events
  • there is no trade commitee
  • 24-hour customer support
  • process deposit and withdrawl (money withdrawal) easy
  • chat channels
  • charting tools easy used
Superiority besides the at mention on, marketiva give to chance to all little investor that wants to do currency trade. Apart from capital usd 5 that given by marketiva, also can their capital increase self with little relative total .

One click Trading
  • Buy and sell financial instruments with one mouse click
  • No Commissions or exchange fees on your trades, you can trade as much as you like
  • You can start trading with as little as $1
  • Open your account for free an get $5 cash reward so you can start trading right away


Diversification and Practise
  • Trade $10,000 with only $100 in your account using 1% margin on forex, index, and commodity desks.
  • If you look for long term profits, you can invest in funds and reduce your investment risk.
  • No interest charged on your open margin position.
  • You don't need to start on live market right away practise with your virtual money first.


News, chat, alerts and support
  • Real time economic news and forecasts about global economy and markets.
  • Get alerts narrated aloud prior to major scheduled market events.
  • Chat with order traders about market events, exchange trading ideas and learn.
  • Get help from maketiva support proffesionals available 24h on support channels

Advanced Personalized Charting
  • The most sophisticated and easy to use charting tool with build in advanced technical indicators.
  • You can trade, view and modify open positions directly on your charts.
  • Modify parameters of technical indicators in real time and see how they appear immediatelly.
  • Build your chart collection by adding your saved chart configurations.


Simple and powerful
  • Easy to use and understand even if you are a beginner.
  • Streamster trading software gives you the best trading experience available.
  • Arrange trading windows according to your preference, set advanced option, and much more.
  • You only 5 minutes to open your account, and it's FREE.

Download Streamster Software now, be successful trader in the forex market. Visit Maketiva website, Open Account Today !

Read More..... »»

25.9.08

Supplemental Site Day

. 25.9.08
1 comments

A. Double Top and Double Bottom

The Double Top and Double Bottom Charting Patterns
One of the charting patterns commonly used by FX traders is that of the double top and double bottom. The double bottom is a pattern where the currency pair touches a low point twice without being able to sustain a break through that point. The double bottom is a charting pattern that suggests where the market may find support.

Conversely, a double top pattern shows a currency pair reaching resistance twice and failing to break through. The chart below offers some insight into how traders can incorporate the double bottom and double top patterns into their trading strategies.


B. Strength of Trends: ADX/DMI
Strength of Trends: A Look at ADX/DMI

Two commonly used indicators in technical analysis -- especially in the futures and equities markets -- are ADX and DMI. Both essentially allow traders to gauge the strength of a trend in the market, thereby helping them to determine if the market is rangebound or trending.
When ADX and DMI are displayed on a chart, three lines will appear. Those lines are as follows:
  • Positive Directional Index (+DI): Measures the strength of the trend for an upward movement in price.
  • Negative Directional Index (-DI): Measures the strength of the trend for a downward movement in price.
  • Average Directional Line (ADX): Measures the strength of the overall trend in the market, regardless of direction.
Those three lines can be used as follows:
  • If ADX is strong -- such as above 25 -- the market is trending strongly. Rangebound strategies may not work well.
  • If Positive DI is above Negative DI, the market is considered to be bullish; if the opposite is true, the market is deemed to be bearish.
  • ADX can be used to determine the strength of the directional trend, as suggested by Positive and Negative DI.
C. JPY Overview
Japanese Yen (JPY)
Japan is the third largest economy in the world with GDP valued at over US$4Trl in 2002 (behind the US and the entire Eurozone or EMU). The country is also one of the world's largest exporters and is responsible for over $400bln in exports per year. Manufacturing and exports account for nearly 20% of GDP. This has resulted in a consistent trade surplus, which creates an inherent demand for the JPY, despite severe structural deficiencies. Aside from being an exporter, Japan is also a large importer of raw materials for the production of their goods. The primary trade partners for Japan in terms of both imports and exports are the US and China. China is becoming an increasingly important trade partner, as China's inexpensive goods have allowed it to gain a larger share of Japan's import market.

Japanese Banking Crisis
In the 1980s, Japan's capital market was one of the most attractive markets for international investors seeking investment opportunities in Asia. They had the most developed capital markets in the region and their banking system was considered to be the one of strongest in the world. The country was experiencing above-trend economic growth and near-zero inflation. This resulted in rapid growth expectations, boosted asset prices and rapid credit expansion, leading to the development of an asset bubble. Between 1990-97, the asset bubble collapsed, inducing a USD$10trl fall in asset prices, with the fall in real estate prices accounting for nearly 65% of the total decline, which is worth two years of national output. This fall in asset prices sparked the banking crisis in Japan. It began in the early 1990s and then developed into a full blown systemic crisis in 1997 following the failure of a number of high profile financial institutions. Many of these banks and financial institutions extended loans to the builders and real estate developers at the height of the asset bubble in the 1980s, with the land as the collateral. A number of these developers defaulted after the asset bubble collapse, leaving the country's banks saddled with bad debt and collateral worth sometimes 60-80% less than when the loans were taken out. Due to the large size of these banking institutions and their role in corporate funding, the crisis had profound effects on both the Japanese and global economy. As a result, enormous bad debts, falling stock prices and a collapsing real estate sector have crippled the Japanese economy for almost two decades.

With Japan experiencing deflationary conditions, each succeeding month of deflation raises the real burden of the banks' outstanding debt. To date, the Japanese Ministry of Finance and Bank of Japan is still grappling with this problem and has only injected capital into these ailing banks as a solution to prevent bankruptcies. Since the beginning of the crisis, they have hoped that the banks would grow their way back to health.

In addition to the banking crisis, Japan has the highest debt level of all of the industrialized countries, at over 140% of GDP. The chart below shows the country's deteriorating fiscal positions, with public debt continuing to rise, which has resulted in the country experiencing over 10 years of stagnation. With this high debt burden, Japan stands at risk of a liquidity crisis.

The banking sector has become highly dependent on a government bailout. As a result, the JPY is very sensitive to political developments such as speeches by government officials with rhetoric that may indicate potential changes in monetary and fiscal policy, attempted bailout proposals, and any other rumors.

Key Indicators for JPY

Balance of Payments, Trade Surplus

These two indicators measure the capital flows and trade flows in and out of Yen. Because Japan is so sensitive to exports and is also a major investor in foreign markets, these two pieces of data are important in tracking the overall flow in and out of Yen. If the Yen strengthens significantly below the 100 level to the dollar, the possibility of trade being affected is very real, and Trade Surplus releases could become significant. The Bank of Japan’s goal in keeping USDJPY artificially inflated is to keep Japanese exports competitive, so trade surplus data that does not meet expectations may give the BoJ new resolve to intervene in USDJPY.

Tankan Survey
The Tankan is a short-term survey of Japanese businesses—divided according to size—that gives an overall outlook of the business climate in the coming months. Published four times per year, the Tankan is watched as a leading indicator, because it summarizes confidence in the future of the economy.

Trading JPY

USDJPY
  • USDJPY is the most heavily traded of all Yen crosses, as the US is the most significant trading partnerfor Japan.
  • In the past this pair has been characterized by frequent and decisive intervention by the Bank of Japan,who has actively bought US dollars for years in the interest of keeping the Yen weak and makingJapanese exports attractive in the US. If USDJPY approaches 100, then there may again be intervention.
  • Unlike ECB intervention, which may occur at certain times due to market conditions, BoJ interventionshould be considered an intrinsic part of trading UDSJPY.
  • Intervention creates strong support levels, which the BoJ defends rigorously. If the market pressure downwards makes a certain price level untenable for the BoJ, it will usually retreat to a slightly lower level and repeat the process of defending it as long as possible.
  • The goal of intervention is to eliminate speculators from the market. Banks and corporations that must physically exchange dollars for Yen can not be removed from the market by intervention, but the BoJ can scare speculative short sellers out of the market by making it too risky for them to hold positions.
EURJPY
Although volume of the Euro against the Franc and the Pound has surpassed that of the dollar, EURJPY remains less heavily traded than USDJPY. Trading in EURJPY is technically more stable than USDJPY for the reason that the Bank of Japan is more interested in the price of the Yen vs. the dollar, and USDJPY is where most intervention occurs. Because USDJPY exchange rates are often driven mainly by USD strength and weakness, EURJPY is a more reliable measure of JPY strength relative to other currencies.

GBPJPY
Like EURJPY, GBPJPY has less volume than USDJPY, but it trades more smoothly because BoJ intervention almost always occurs in USDJPY. GBPJPY can be used as a more reliable measure of JPY strength than USDJPY, since often pairs involving the dollar move based on USD weakness or strength rather than the strength of other currencies. Because there is less trading volume in this cross, spreads are typically wider than the major pairs, but it is still a relevant cross.

Read More..... »»

Psychology of Trading

.
2 comments

A. The Psychology of a Good Trader
Being a good trader involves more than just being able to analyze the market technically and/or fundamentally. One of the most crucial yet overlooked elements of successful trading is maintaining a healthy psychological outlook. At the end of the day, a trader who is unable to cope with the stress of market fluctuations will not stand the test of time – no matter how skilled they may be at the more scientific elements of trading.

Emotional Detachment
Traders must make trading decisions based on strategies independent of fear and greed.
One of the premiere attributes of a good trader is that of emotional detachment: while they are dedicated and fully involved in their trades, they are not emotionally married to them; they accept losing, and make their investment decisions on a mental level. Traders who are emotionally involved in trading often make substantial errors, as they tend to whimsically change their strategy after a few losing trades, or become overly carefree after a few winning trades. A good trader must be emotionally balanced, and must base all trading decisions on strategy – not fear or greed.

Know When to Take a Break
In the midst of a losing streak, consider taking a break from trading before fear and greed dominate your strategy.
As noted in the money management section of the course, losing is an inevitable part of trading. Not every trade can be successful. As a result, traders must be psychologically capable of coping with losses. Most traders, even successful ones, will go through a stretch of losing trades. The key to being a successful trader, though, is being able to come through a losing stretch unfazed and undeterred.

If you are going through a bad stretch, it may be time to take a break from trading. Often, taking a few days off from watching the market to clear your mind can be the best remedy for a losing streak. Continuing to trade relentlessly during tough market conditions can breed greater losses as well as damaging your psychological trading condition. Ultimately, it’s always better to acknowledge your losses rather than continue to fight through them and pretend that they don’t exist.

B. GBP Overview
The British Pound (GBP)
The United Kingdom is the world's fourth largest economy with GDP valued at over USD$2.9 trillion in 2002. At this writing the UK is economically strong, with low unemployment, expanding output, and resilient consumption. The strength of consumer consumption has in large part been due to a strong housing market, which some feel has expanded too far and too fast and may be due for a correction.

The UK has a service-oriented economy, with manufacturing representing an increasingly smaller portion of GDP, equivalent to only one fifth of national output. Britain boast one of the most developed capital market systems in the world, and as a result insurance and banking have become the strongest contributors to GDP.
Although the majority of the UK's GDP is from services, it is important to know that they are also one of the largest producers and exporters of natural gas in the EU. The energy production industry accounts for 10% of GDP, one of the highest shares of any industrialized nation. This is particularly important, as increases in energy prices (such as oil), will significantly benefit the large number of UK oil exporters.

Overall, the UK is a net importer of goods and runs a consistent trade deficit. Its largest trading partner is the EU, with trade between the two constituencies accounting for over 50% of all of the country's import and export activities. The US, on an individual basis, still remains the UK's largest trading partner.

A long-term issue that the UK is grappling with is whether or not to adopt the Euro. The decision on Euro entry has significant ramifications for the UK economy. Currently, this is the key political and economic issue on the government's agenda. The Treasury has specified five economic tests that must be met prior to Euro entry.

These tests are:
UK's Five Economic Tests for Euro
  1. Is there sustainable convergence in business cycles and economic structures between the UK and other EMU members, so that the UK citizens could live comfortably with euro interest rates on a permanent basis?
  2. Is there enough flexibility to cope with economic change?
  3. Would joining the EMU create an environment that would encourage firms to invest in the UK?
  4. Would joining the EMU have a positive impact on the competitiveness of the UK's financial services industry?
  5. Would joining the EMU be good for promoting stability and growth in employment?
Key Economic Indicators for GBP

Housing Starts

Housing has long been one of the strongest areas of the UK economy, and this periodically creates concern that the housing market may be in the midst of a bubble. A second concern is that a runaway housing market could cause inflationary pressures. For these two reasons, stronger than expected housing numbers can be a preliminary sign that a hike in interest rates is on the way.

Retail Price Index (RPI-X)
The RPI-X is an inflation indicator that measures the prices of consumer goods. The market follows the RPI-X that excludes mortgages, and the target set by the BoE for inflation is a 2.0% annual growth in RPI-X. A sharp rise in the RPI-X could be seen as an indicator of future interest rate hikes in GBP, as the Bank of England attempts to curb inflation. The BoE has recently started using the Harmonized Index of Consumer Prices or HICP as an indicator of inflation rather than RPI. HICP excludes housing as a measure of inflation, so there is a greater separation between housing prices and other consumer prices as measures of inflation, but both certainly weigh on the BoE's interest rate decisions.

Energy Prices
Because the UK is a large exporter of crude oil, higher energy prices can affect the demand for the GBP and, in turn, its exchange rates. There is an energy component in the HICP, but large swings in energy prices can occur in real time, while the HICP data is not compiled until a later date. This means that swings in energy prices can be a very early sign of inflationary pressures, which can then affect interest rates.

Trading GBP
GBPUSD
Like other major USD crosses, GBPUSD often moves more on dollar weakness than it does on GBP strength. Trading volume remains higher in GBPUSD than any other GBP pair, but it often reacts to moves in EURUSD and EURGBP. When the market is moving on GBP strength rather than on USD weakness that ties GBPUSD to other USD crosses, GBPUSD can move in large daily ranges over several hundred pips. It often trades in a range for several days or even weeks before breaking out to a new level and trading in a range again. This means that both the range trade and the breakout strategy can be profitable, as long as traders are willing to quickly cover losses if the market conditions seem to be changing.

EURGBP
Trading volume is comparatively higher in GBPUSD, but major moves in EURGBP that show GBP strength or weakness will typically influence the movement of GBPUSD. Often the strength of the pound against the dollar will closely mirror that of the Euro, and there will be little in the way of decisive movement between the Euro and Sterling. If the market starts to trade on GBP or EUR strength, though, rather than on USD weakness or strength, there can be decisive movement in EURGBP.

Read More..... »»

Money Management

.
1 comments

A) Why Do Most Traders Lose Money?

The fact is that most traders, regardless of how intelligent and knowledgeable they may be about the markets, lose money. What could be the cause of this? Are the markets really so enigmatic that few can profit, or are there a series of common mistakes that befall many traders? The answer is the latter, and the good news is that the problem, while it can be emotionally and psychologically challenging, can be solved by using solid money management techniques.Most traders lose money simply because they do not understand or adhere to good money management practices.. Part of money management is essentially determining your risk before placing a trade. Without a sense of money management, many traders hold on to losing positions far too long, but take profits on winning positions prematurely. The result is a seemingly paradoxical scenario that in reality is all too common: the trader ends up having more winning trades than losing trades, but still loses money.

Money Management is the Key
Key Money Management Practices
So, what can traders do to ensure they have solid money management habits?
There are a few key guidelines that every trader, regardless of their strategy or what instrument they are trading, should keep in mind:
  • Risk-Reward Ratio. Traders should establish a risk-reward ratio for every trade they place. In other words, they should know much they are willing to lose, and how much they are seeking to gain. Generally, the risk-reward ratio should be 1:2, if not more. This means risk should equal no more than one-half of the potential reward. Having a solid risk-reward ratio can prevent traders from entering positions that ultimately are not worth the risk.
  • Stop Loss Orders. Traders should also employ stop-loss orders as a way of specifying the maximum loss they are willing to accept. By using stop-loss orders, traders can avoid the common scenario where they have many winning trades but a single loss large enough to eliminate any trace of profitability in the account.
B. Using Stop-Loss Orders to Manage Risk
Due to the importance of money management to long-term successful trading, the use of a stop-loss order is imperative for any trader who wishes to succeed in the currency market. The stop-loss order allows traders to specify the maximum loss they are willing to accept on any given trade. If the market reaches the rate the trader specifies in his/her stop-loss order, then the trade will be closed immediately. As a result, the use of stop-loss orders allows you to quantify your risk every time you enter a trade.

There are two parts to successfully using a stop-loss order: (1) initially placing the stop at a reasonable level and (2) trailing the stop – meaning moving it forward towards profitability – as the trade progresses in your favor.

Placing the Stop-Loss
Here are two recommended ways of placing and trailing a stop-loss order:
  • Two-Day Low. This technique involves placing your stop-loss order approximately 10 pips below the 2 day low of the pair. The idea behind this technique is that if the price breaks to new lows, the trader does not want to hold the position. For example, if the low on the EUR/USD’s most recent candle was 1.2900, and the previous candle’s low was 1.2800, then the stop should be placed around 1.2790 – 10 pips below the 2 day low – if a trader wishes to enter. As another day passes, the trader can raise the stop to 10 pips below the new two-day low.
  • Parabolic SAR. One type of volatility-based stop is the Parabolic SAR, an indicator that is found on many currency trading charting applications. Parabolic SAR is a volatility-based indicator that graphically displays a small dot at the point on the chart where the stop should be placed. Below is an example of a chart using Parabolic SAR.


C. EUR Overview
The European Monetary Union (EUR)
The European Union (EU) was developed as an institutional framework for the construction of a united Europe. The EU consists of 25 member countries; Austria, Belgium, Denmark, Finland, France, Germany, Greece, Ireland, Italy, Luxembourg, The Netherlands, Portugal, Spain, Sweden, Cyprus, Czech Republic, Estonia, Hungary, Latvia, Lithuania, Malta, Poland, Slovakia, and Slovenia and the United Kingdom. Twelve of these countries use the euro as a common currency. They are known as the European Monetary Union (EMU). Aside from a common currency, these countries also share a single monetary policy dictated by the European Central Bank or (ECB).

The EMU Today
The EMU is the world's second largest economic power, with GDP valued at over US$11Trl in 2003. With a highly developed fixed income, equity and futures market, the EMU is the second most attractive investment market for domestic and international investors. The EMU is primarily a service-oriented economy; services account for approximately 70% of GDP, while manufacturing, mining and utilities only account for 22% of GDP.

The EMU is both a trade and capital flow driven economy, and it has emerged as a legitimate competitor for the US in terms of capital investments. German bonds are a common alternative to US Treasuries. Unlike most major economies, the EMU does not have a large trade deficit or surplus. In fact, the EMU went from a small trade deficit in 2001 to a small trade surplus in 2002. EU exports comprise approximately 19% of world trade, while EU imports account for roughly 20% of total world imports. Because of the size of the EMU's trade with the rest of the world, it has significant power in the international trade arena. International clout is one of the primary goals in the formation of the EU, because it allows the individual countries to group as one entity and negotiate on an equal playing field with the US, who is their largest trading partner.

The Future of the EUR
The EU's growing role in international investment and trade has important implications for the role of the Euro as a reserve currency. It is important for countries to have a large reserve of currencies to reduce exchange risk and transaction costs. Traditionally, most international transactions involved the British Pound, the Japanese Yen, and/or the US Dollar. Before the establishment of the Euro, it was unreasonable to hold large amounts of every individual EU national currency. As a result, currency reserves were weighted heavily toward the dollar. At the end of the 1990s, approximately 65% of all world reserves were held in US dollars, but now with the introduction of the a single European currency, foreign reserve assets are shifting in favor of the euro. This trend is expected to continue, as the EU becomes one of the major trading partners for most countries around the world.

Economic Indicators for EUR
GDP for Germany, France, Italy
Germany has the largest economy in Europe, and German economic data moves the EUR price more than any other nation’s economic releases. French and Italian GDP is less important than German data, but it is still relevant to the EUR. GDP is the central measure of economic growth in a nation, and if the GDP of a given country exceeds or fails to meet expectations by a significant amount, currency markets often become volatile as a result. Because German data is more heavily weighted than French or Italian, a small difference between German expectations and releases would have the same effect as a much larger gap in French or Italian data.

Unemployment
Because of the political environment in Europe, unemployment data is an even more important indicator than it is in most other nations. Organized labor is politically more powerful in Europe than it is in the US, and Europe is much more sensitive to changes in employment. German, French, and Italian unemployment data can affect the level of the EUR, aside from having political implications as well. Unlike unemployment in the US, unemployment in Europe is an important indicator at all times.

Ten Year German Bund
German ten year bonds are the closest equivalent to the US 10 Year Treasury, and the difference in these 10 year rates can be an indication of where capital investments are likely to go as investors seek the highest return. This in turn will drive up the value of the currency in which the bonds are held.

Money Supply (M3)
One of the mandates of the ECB is to maintain low inflation, and one of the tools it uses to this end is control of the money supply. In order to maintain a target inflation rate of 2%, the ECB looks for an increase of roughly 4.5% in M3. If M3 is much higher than expected, it can be a sign that inflation is increasing and that a rate hike might be coming. Inflation is of much greater concern in Europe than it is in the US, and it usually comes much earlier in the economic cycle. This means that the ECB is more likely to aggressively raise interest rates than the FOMC, and the market may react to early signs of rate hikes.

Trading EUR
The Euro has emerged as a competitor to the dollar as a destination of foreign investment, and because the Eurozone is a major trading partner with many other countries, most crosses in EUR have high trading volume. EURUSD is the most heavily traded currency pair, while EURCHF and EURGBP have emerged as the dominant crosses for both CHF and the GBP.

EURUSD
  • Most heavily traded of all currency pairs, with the narrowest spread on the interbank market as buyers and sellers compete over the inside market.
  • Most active beginning 8:00 GMT (3 am EST) at the beginning of London trading hours. London is the dominant FX market in the world, especially for EUR, CHF and GBP pairs.
  • Often has little activity after the middle of the US session (roughly 1700 GMT).
  • Follows technical analysis extremely well, and is well suited to breakout or trend trades. The pair is poorly suited to range trades most of the time because of the large number of speculative traders.
  • Follows movement in capital markets: bond markets or equities, depending on which is most active at the time. When equities are experiencing a strong bull market, the S&P 500 can act as a leading indicator for USD strength against the Euro. When bond markets are dominant, the difference in yields on a 10 year German Bund and the US 10 year Treasury can identify movement of capital in the pair.
  • Open interest on the Euro Futures market on the Chicago Mercantile Exchange can be used as a rough indicator of market interest and positioning, although it is not a perfect volume indicator.
  • Reacts to data out of a variety of countries, sometimes focusing heavily on US releases, other times focusing on data out of Germany, France, and Italy. Because it trades more often in trends than in a range, indicators like moving averages or crossovers are more often useful than Bollinger bands or RSI.

Read More..... »»

Look Back- Fundamental Analysis

.
0 comments

A. Fundamental Analysis

The true movements of currencies are based upon fundamentals – capital flows, trade flows, economic numbers, rumours and news. Technical analysis, on the other hand, is a strategy that calls for focusing upon historical price patterns, all of which are very subjective -- there are a million different technical analysis patterns, any of which a trader can use to argue his/her bias. At any one time, it will be easy for technical analysts to find indicators offering conflicting signals, with some pointing to an upward bias and others indicating a negative bias.
Fundamental analysis on the other hand, is based upon finding the intrinsic value of a currency pair. Fundamentalists focus on the forces that move currencies and how they impact its intrinsic value. Below are some theories as to why fundamental analysis may be superior to technical analysis:

Using Fundamental Analysis to Forecast Long-Term Directional Trends
One of the key advantages of fundamental analysis is the ability to forecast long-term directional trends. Fundamental analysis serves as a guide to gauge whether currencies are undervalued or overvalued. Over the long run, currencies rarely trade in ranges and instead develop strong trends. Therefore it is important to use fundamental analysis to gage the direction of the trend. A classic example is the EURUSD, which has been trending upwards since 2002. This trend can be easily explained by the ballooning US current account deficit, the US government’s waning commitment to a strong dollar, as well as the prospects of a jobless recovery. Big money can be made using fundamental analysis, as traders can take advantage of long-term fundamental shifts
in the markets.


Fundamentals Can Cause Short-term Movements
Besides being able to forecast the long-term directional trend of a currency pair, fundamental analysis can also be used to forecast sudden short-term movements. Economic data, rumors and news all have the potential to impact currency movements. For example, potential intervention by the Bank of Japan kept USDJPY well supported between late May and early July of 2003. Comments from central bankers also move markets - ECB Duisenberg’s comment that a fall in the dollar is “unavoidable” explains the bulk of the 200-pip EURUSD rally on October 6, 2003. Surprises in economic data also move markets – economic data that consistently beat expectations in Australia recently propelled the currency to five-year highs.

B. Technical Analysis
Coinciding with the increasing popularity of computerized trading across all investment arenas is the ability for traders to employ technical analysis. As markets tend to become inundated with information, and as charting applications are able to provide traders with an increasing array of data, technical analysis has become both practical and relevant. Below are some theories as to why traders need to develop an understanding of technical-based trading.

Determine Precise Entry/Exit Points
Fundamental analysis’ most glaring weakness is its lack of precise entry, exit and stop points. Fundamental traders tend to have more of a spontaneous process regarding when they should enter trades. In theory this may not prove too harmful, but in reality it increases the likelihood of a trader becoming more erratic in their style, and more prone to classic money management and psychology mistakes. On the other hand, technical analysis demystifies the market; traders have certain rules and concepts that allow them to determine precise points at which they should place their orders. This facilitates the employment of a disciplined strategy.

The chart below illustrates how a technical trader can determine when to get in and out of the market.


Analyzing Instead of Forecasting
One of the most common complaints about technical analysis is that it fails to consider the very factors that result in the movement of exchange rates; it only looks at statistics and patterns, which are derivatives of market activity, not causes of it. Accordingly, the rationale is that technical analysis is an ineffective tool at forecasting:
it does not look at the causes of exchange rate movement, and hence cannot justifiably determine the future effects of exchange rates.

This is undeniably true. It is, however, misleading. The reason why technical analysis works well is precisely because it does not involve forecasting or predicting – it considers only what is actually going on in the market regarding who is buying and who is selling. This is the true information in the market, and for some traders it is the only information that really matters. The market is simply a battle between buyers and sellers – and thus, technical analysis reasons that looking at the statistics behind this “battle” is all that is really needed to determine what really is going on in the market, and how to profit accordingly.

Error On the Chart
In the first month that the course existed, we noticed that there several errors in the chart. One deals with Fib retracement levels plotted above and how they were used as a trading signal, the other deals with a candlestick. Rather than correct the chart I decided to leave it in and see if anyone noticed the error. So the question is:
What is wrong with the way that we used the Fib retracement level as a trading signal in the above chart? Also, what error deals with a candlestick pattern?

C. Short Term Trading
Many new forex traders find it difficult to determine whether they want to be a long-term or short-term trader. While there are justifiable reasons to be either type, in the end traders are looking for the trading style that is most profitable. Short term trading is one possible means to that end. Here are some of the advantages of short-term trading.
  • Prices are driven by order flow, which is more predictable over the short term
  • Long term trading is subject to greater volatility
Easier to Predict Order Flow in the Short Term
Due to greater leverage and lower transaction costs, short-term active traders have flocked to the FX market due to its benefits. Since many of these short-term traders review the same technical analysis patterns to base their trading decisions, many of the moves seen in this market are self-fulfilling prophecies. The reason for this is because if you have knowledge of where the most significant technical levels are located at any point in time and also realize that the majority of the other traders in this market base their trading decisions on the same technical analysis, this provides a trader with a strong idea of where order flow lies at any given price.
Therefore, one can predict with a good degree of precision the real factor that drives market prices, namely order flow. With longer time frames – such as daily, weekly, and monthly charts – the flow of orders is harder to predict; more technical patterns and interpretations are possible, as well as input from a greater number of fundamental factors that will affect the market in the long-term. Because of this, order flow – and hence exchange rate movement – becomes more difficult to predict in the long run.

Long Term Trading is More Volatile
With long-term trading, there are many factors that drive currency prices which are extremely difficult to predict. In addition to long-term technical patterns, there is the increased importance of long-term fundamental factors, such as capital flows and trade flows. In addition to the increased number of factors that need to be considered is the fact that currency pairs are more volatile over longer periods of time – meaning that long-term traders may in fact lose more than their short-term counterparts. For example, a trader looking to get in and out of positions within a single day is most likely dealing with a range of no more than 100 pips; a long-term trader, however, must be prepared to cope with the fact that currency pairs can easily move several hundred pips or more. If a trader is on the wrong side of a long-term trade, the loss could potentially be devastating.

Long-term traders typically rely on fundamental factors to base their trades, such as economic data releases and interest rate differentials seen over time. While such fundamental factors in fact cause movements in the market, the problem is that such fundamental factors are too difficult to predict over the long term and leave long term traders overly exposed to adverse market movements, which often cannot be seen or predicted until it is too late.

The above chart depicts three profitable entry points on three separate trading days by putting short term technical analysis to work. Substantial profits could be reaped from these three opportunities alone.

D. Long Term Trading
Many new forex traders find it difficult to determine whether they want to be a long-term or short-term trader. While there are justifiable reasons to be either type, in the end traders are looking for the trading style that makes them the most profitable. Long term trading is one means to that end.

Short term trading is subject to excessive volatility
Short term trading patterns can change in seconds or minutes. It is very difficult to trade and subject to too many external factors such as breaking news releases or large flow. In short term trading there are frequently false breakouts that can throw many traders off. Why deal with this excess stress when large profits can be made with long-term trading? Yes, there is also volatility in long-term trading – however, as long as stops are placed at the proper levels, the overall trend tends to remain intact, and the significance of day-to-day fluctuations is largely minimized.

Large profits are made with long-term trading
Forex markets are trending markets. This means that traders do not need to be glued to their trading screens 24/7 in order to make money. Too much stress is involved in short-term trading, as the market must be constantly watched and each small move becomes a major event. Since most traders do not trade full time, and certainly are not watching the markets 24 hours a day, short-term trading simply too demanding and quiteunfeasible. With most traders, the psychological difficulties of short-term trading get the best of them, and the traders may end up taking profits too early or cutting losses too late. If traders pre-commit to a long-term target and stop, they can make money while erasing the need to know where the EURUSD is trading at every minute. In fact, substantial profits can be made with long term trading. It is highly unlikely for short-term traders to ever claim that they can make 1907% in 10 months of 3296% in 18 months. Below are examples of how large profits could have been made if traders held their positions long-term.

USDCHF
Hold short position from 1/2002 to 6/2003 = 4395 pips in profit = approx $32960 on 1 lot of 100,000 units, using $1000 in margin = 3296% in 18 months


USDCAD
Hold short position from 1/2003 to 10/2003 = 2543 pips in profit = approx $19070 on 1 lot of 100,000 units, using $1000 in margin = 1907% in 10 months


Read More..... »»

Short Term Fundamental Analysis

.
1 comments

A. Event-Driven Trading

The Importance of News
  • Exchange rate fluctuations are highly correlated with news.
  • News that is unexpected tends to have a major impact on the market.
The most important aspect of interpreting news and its impact on the foreign exchange markets is the determination of the market's expectations for that news. In the financial world, this is commonly referred to as the "market discount mechanism". The correlation between currency markets and news is pretty clear. Expected news has little impact on exchange rates while unexpected news, especially when pertaining to potential changes in monetary policy, may have an immense impact. Short-term traders need to closely monitor financial publications like The Financial Times and The Wall Street Journal, as they are excellent gauges of current sentiment towards potential news events. Being aware of events and expectations allows traders to be fully prepared for, and profit from, the discounting of potential market moving events.

Event-Driven Trading
  • It is difficult to determine the effect of news on currency movements.
  • Traders need to avoid analyst bias and take special care when trading during economic releases.
Event-driven trading is a fundamental based methodology that attempts to exploit the volatility associated with economic releases and political announcements. Often times it is quite difficult to determine the effect of news on currency movements, and because of this traders need to avoid biased analysis and adopt a defensive posture during these events. Generally, as fundamental news becomes available, the market as a whole will assimilate the news and move the exchange rates to more appropriate levels as market perceptions adjust accordingly. The event driven trader seeks to profit from this ensuing shift in price. Timing of event driven trades is obviously a key factor to success as positions entered prematurely or belatedly can have significant adverse impacts on P&L. For this reason, profitable event-driven traders usually incorporate some form of technical analysis that helps to validate the merit of the fundamental catalyst.

A Common Error
  • News releases can lead to sharp volatility in FX, but this volatility can begin well in advance of the actual announcement.
  • Much of this volatility occurs in the days leading up to the announcement.
Economic releases can lead to sharp increases in volatility in the currency markets. This rise in volatility can begin days in advance of an announcement and end days later. The most common mistake made by most novice traders is to enter positions after a particular announcement hits the new wires in an attempt to profit from the perceived good or bad news. What they fail to realize is that if an economic release meets expectations, there will likely be no reaction to the news because it is already 'priced in' to the market. The reaction of the market is based on the market's expectations, not on whether the news was intrinsically good or bad.

Buy the Rumour, Sell the News
Rather than trade on the announcement itself, some participants prefer to trade on the rumors that circulate before its release.
Bank dealers and institutional traders often adhere to the old Wall Street adage of “buy the rumor, sell thenews”. Rumors of a positive report will typically begin to circulate among trading desks and hedge funds days before an expected release date. The institutions will then use this information to position themselves on the long side. When the news comes out as expected, they then sell their positions to a frantic public, profiting from the run-up to the announcement as opposed to guessing the reaction to it.

USD/JPY is a good example of an event driven trade where technicals and fundamentals were in clear alignment. Notice how the pair breaks the neckline of a bearish Head & Shoulders pattern the week before the crucial G-7 Meeting in Dubai.

B. Key Economic Terms
A number of economic terms are particularly relevant to the FX market. The following is a list of economic indicators that are released on a scheduled basis and are observed by traders and analysts. Analysts project their estimates for results of these economic statistics, and the market's reaction to this news is usually based on these estimates.

Unemployment
The unemployment rate is a measure of the strength of the labor market. One of the ways analysts gauge the strength of an economy is by the number of jobs created, and the percentage of workers unable to find jobs. Strong job creation is indicative of economic growth, as companies must increase their work force in order to meet demand.

CPI (Consumer Price Index)
The CPI is a key gauge of inflation, as it measures the price of a fixed basket of consumer goods. Higher prices are considered negative for an economy, but since central banks often respond to price inflation by raising interest rates, currencies sometimes respond positively to reports of higher inflation.

PPI (Producer Price Index)
The PPI is another gauge of inflation, but it differs from CPI as it measures inflation at the producer or wholesale level. Note that because food prices are seasonal and energy prices are frequently volatile, many analysts tend to focus on the core rate of inflation, which excludes food and energy prices. The PPI affects various markets in a similar respect to the CPI, because the prices producers receive ultimately affects the prices consumers pay.

GDP (Gross Domestic Product)
GDP measures the total production and consumption of goods and services, representing the total economic output of a nation. It is calculated by adding expenditures by households, businesses, governments and net foreign purchases.

Balance of Trade
The balance of trade measures the difference between the value of goods and services that a nation exports and the value of goods and services that it imports. A trade surplus results if the value of exported goods exceeds that of imported goods, whereas a trade deficit exists if imported goods exceed exported goods.

Manufacturing Indices (ISM, PMI)
Manufacturing indices measure manufacturing activity, usually in a particular region of the country. Since they are an indication as to whether the economy is expanding or contracting, FX participants place heavy emphasis on these figures.

Consumer Confidence (Michigan Index, Consumer Conference Board, etc.)
Consumer confidence is a measure of the level of confidence in economic performance. It is calculated via the results of a survey asking participants what they think of the economy relative to both the past and the future. These numbers can be a precursor to the level of future consumer spending.

Retail Sales
Retail sales is a measure of the total goods sold by a sampling of retail stores. It is used as a gauge of consumer activity and confidence as higher sales figures would indicate increased economic activity.

Industrial Production
Industrial production measures the change in the physical output of factories, mines, gas and electric utilities. A rise in the IP value signals economic growth. Note that unlike sales value, which incorporates both quantity and price, IP solely refers to the physical quantity of items produced.

Read More..... »»

24.9.08

Long Term Fundamental Analysis

. 24.9.08
0 comments

A. What is Fundamental Analysis?

There are two major schools of thought to analyzing financial markets: fundamental analysis and technical analysis. Fundamental analysis focuses on underlying economic conditions and indicators-for example economic growth rates, interest rates, inflation, and unemployment-, while technical analysis uses historical prices-through charts for example-to predict future movements. Though there exists debate over which school of thought is more accurate, short-term traders prefer to use technical analysis, focusing their strategies primarily on price action; while fundamental traders tend to be more long term focusing their efforts on determining a currency's proper current as well as future valuation.

While the majority of the course will cover technical analysis, an explanation of fundamental analysis is appropriate here as a backdrop to understanding what actually drives currency values and maintaining a big picture perspective.

Fundamental analysis focuses on the economic, social and political forces that drive supply and demand. There are two main factors that impact exchange rate movements from a fundamental perspective: capital flows and trade flows.

Capital Flows
Capital flows measure the net amount of a currency that is being purchased or sold due to capital
investments. A positive capital flow balance implies that foreign inflows of physical or portfolio
investments into a country exceed outflows. As inflows exceed outflows for a specific country, demand for that country’s currency will increase thus increasing that country’s currency value. Conversely, a negative capital flow balance indicates that there are more physical or portfolio investments bought by domestic investors than foreign investors. Therefore, there will be more capital outflows than inflows into the domestic country decreasing demand for that country’s currency and thus that country’s currency value. Generally, global capital will flow to whichever country offers the highest return on investment through high interest rates, economic growth, or growing domestic financial markets for example. So if a country’s stock market is doing well and/or interest rates are high, capital will flow into that country increasing the demand for the country’s currency and causing its value to appreciate.

To clearly explain this, suppose for example that the UK economy is booming, and that its stock market is rallying as well. Meanwhile, in the United States, a lackluster economy is creating a shortage of investment opportunities. In such a scenario, the natural result would be for US residents to sell their dollars and buy GBP to allow for participation in the rallying UK economy. This would result in an outflow of capital for the US and inflow of capital for the UK. From an exchange rate perspective, this would induce a fall in the USD coupled with a rise in the GBP as demand for USD declines and the demand for GBP increases; in other words, the GBP/USD would rise.

Capital flows measure the net amount of a currency that is being purchased or sold due to capital
investments and thus affects the value of exchange rates. As capital flows into a country, international investors must change their “capital” into the domestic currency of the country where it is being deposited. This in turn increases the demand for the country’s currency to where capital is flowing and causes the value of that country’s currency to appreciate. Conversely, capital flowing out of a country will cause that country’s currency to depreciate. Generally, global capital will flow to whichever location or country offers the highest returns. To put this in perspective, imagine you had $100 to deposit anywhere in the world. In the US, you could buy a short term treasury earning 3% or you could change your US dollars into pounds and earn 7%. Clearly you would chose to change your money into GBP (assuming there was no change in the exchange rate). Now think about this occurring on a massive scale as largeinvestors, mutual funds, hedge fuds, corporations, etc deposit their funds in Britain to earn 7%. As investors change their money into GBP, this will increase the demand for GBP and, in turn, cause the GBP to appreciate vs the USD. In sum, GBP/USD will rise.

In later lessons, we will further explain how to incorporate fundamentals into your trading strategy.

Trade Flows
Trade flows are the basis of all international transactions and represent a country's net trade balance of exported goods minus imported goods. Countries that are net exporters - meaning they export more to international clients than they import from international producers, will experience a net trade surplus. This net trade surplus pressures the exporting country’s currency to rise. More specifically, international clients interested in buying the exported product/service must first buy the appropriate currency, thus creating demand for the currency of the exporter. Japan is an example of an export driven economy with a trade surplus. Japan's trade surplus is the major reason that the JPY has not depreciated sharply as a result of their severe economic weakness. They are a net exporter with a current account surplus representing 3% of their GDP. This is the highest of the G-7 countries, and creates a strong inherent demand for the currency for trade purposes, regardless of economic conditions.

Countries that are net importers - meaning they make more international purchases than international sales – experience what is known as a trade deficit, which in turn has the potential to drive the value of the currency down. In order to engage in international purchases, importers must sell their currency to purchase that of the retailer of the good or service; accordingly, this could have the effect of driving the currency down. For example, the US is a net importer, with a very high trade deficit that requires $1.9 billion in daily inflow to prevent a further trade-based depreciation of the USD. Clearly a change in the balance of payments has a direct effect on currency levels. Therefore, it is important for traders to keep abreast of economic data relating to this balance and understand the implications of changes in the balance of payments.

Trade Flows vs Capital Flows:
Because international trade of goods and services is relatively slow, it takes time to affect the FX market. Therefore, traders should generally consider economic data to analyze trade flows when considering the more long term fundamental backdrop for the market. Conversely, traders should consider information on growing equity or bond markets in a country as direct and more immediate indications that capital is flowing in and could have an effect on the currency in the shorter term.

B. Capital Flows
• Capital flows represent money sent from overseas in order to invest in foreign markets. Capital flows measure the net amount of a currency that is purchased or sold for capital investments. The key concept behind capital flows is balance. For instance, a country can have either a positive or negative capital flow.

• A positive capital flow balance implies that investments coming into a country from foreign sources exceed the investments that are leaving that country for foreign sources.
As inflows exceed outflows for any given country, there is a natural demand for more of that country's currency. This demand causes the value of that currency to increase because a foreign investor must change his currency into the domestic currency where he is depositing his money.

• A negative capital flow balance indicates that investments leaving a country for foreign sources exceed investments coming into a country from foreign sources.

When there is a negative capital flow, there is less demand for that country's currency, which causes it to lose value. This is because the investor must sell his local currency to buy the domestic currency where he is depositing his money.

Countries that offer the highest return on investment through high interest rates, economic growth, and growth in domestic financial markets tend to attract the most foreign capital. These countries maintain a positive capital flow. If a country's stock market is doing well, and they offer a high interest rate, foreign sources are likely to send capital to that country. This increases the demand for this currency, and causes it's value to appreciate.

As an example, let us take a booming economy in the United Kingdom and a sluggish economy in the United States. In the UK, the stock market is performing very well, while in the United States there is a shortage of investment opportunities.
In this scenario:
  • US residents sell their US dollars and buy British Pounds to take advantage of a booming economy.
  • Capital flows out of the United States into the United Kingdom.
  • Demand for GBP increases and demand for USD decreases.
  • The value of USD decreases in relation to the value of the GBP.


C. Trade Flows
  • Trade flows are the buying and selling of goods and services between countries.Trade flows measure the balance of trade (exports – imports). This is the amount of goods that one country sells to other countries minus the amount of goods that a country buys from other countries. This calculation includes all international transactions and represents a country's trade balance.
  • Countries that are net exporters export more to international clients than they import from international producers. Net exporters run a trade surplus. This is due to the fact that they sell more goods to the international market than they purchase from the international market. Demand for that country's currency then increases because international clients must buy this currency in order to buy these goods. This causes the value of a country's currency to rise.
  • Countries that are net importers import more from international producers than they export to international clients. Net importers run a trade deficit. This is due to the fact that they purchase more foreign goods than they sell to the international market. In order to purchase these international goods, importers must sell their domestic currency and buy a foreign currency. This causes the value of the domestic currency to fall. As an example, let us look at Japan, which is an export driven economy with a trade surplus. Japan exports more goods to international clients than they import from international producers.
  • Japan's trade surplus is the major reason why the JPY has not depreciated sharply despite severe economic weakness.
  • Japan is a net exporter with a current account surplus of 3% of GDP.
  • This creates international demand to buy JPY in order for international clients to purchase Japanese products.
Clearly a change in the balance of payments from one country to another has a direct effect on currency levels. Therefore, it is important for traders to keep abreast of economic data relating to this balance and understand the implications of changes in the balance of payments.

JPY appreciates despite economic weakness. From 8/2003 – 12/2003 USD/JPY went from 121.00 to 107.00.


D. Capital Flows vs. Trade Flows
What is Fundamental Analysis?
  • Fundamental analysis focuses on underlying economic conditions and indicators - for example economic growth rates, interest rates, inflation, and unemployment. It is more accurate when used in long term trading strategies.
  • Technical analysis uses historical prices and charts to predict future movements in prices. It is more accurate when used in short term trading strategies.
Two major schools of thought exist in regard to the analysis of financial markets: fundamental analysis and technical analysis.
Though a debate exists over which school of thought is more accurate, accuracy is really a function of the trader's time horizon. Short-term traders prefer to use technical analysis because these traders focus their strategies primarily on historical price action. Long term trading is more suited to fundamental traders as they analyze a currency's proper current value as well as future value.
While the majority of the course covers technical analysis, it is necessary to understand what truly drives currency values. Fundamental analysis will allow us to see the big picture and will serve as a backdrop for the rest of the course.

Fundamental analysis is based in pure economics. It looks at the social and political forces that drive supply and demand. To this end, there are two main factors that impact exchange rate movements from a fundamental perspective:
  • Trade Flows
  • Capital Flows
Capital Flows
  • Capital Flows are the amount of currency that is bought or sold in order to invest in foreign markets. Capital flows measure the net amount of a currency that is purchased or sold for capital investments. The key concept behind capital flows is balance. For instance, a country can have either a positive or negative capital flow.
  • A positive capital flow balance implies that investments coming into a country from foreign sources exceed the investments that are leaving that country for foreign sources. As inflows exceed outflows for any given country, there is a natural demand for more of that country's currency. This demand causes the value of that currency to increase because a foreign investor must change his currency into the domestic currency where he is depositing his money.
  • A negative capital flow balance indicates that investments leaving a country for foreign sources exceed investments coming into a country from foreign sources.
When there is a negative capital flow, there is less demand for that country's currency, which causes it to lose value. This is because the investor must sell his local currency to buy the domestic currency where he is depositing his money.

Countries that offer the highest return on investment through high interest rates, economic growth, and growth in domestic financial markets tend to attract the most foreign capital. These countries maintain a positive capital flow. If a country's stock market is doing well, and they offer a high interest rate, foreign sources are likely to send capital to that country. This increases the demand for this currency, and causes it's value to appreciate.
As an example, let us take a booming economy in the United Kingdom and a sluggish economy in the United States. In the UK, the stock market is performing very well, while in the United States there is a shortage of investment opportunities.

In this scenario:
  • US residents sell their US dollars and buy British Pounds to take advantage of a booming economy.
  • Capital flows out of the United States into the United Kingdom.
  • Demand for GBP increases and demand for USD decreases.
  • The value of USD decreases and the value of GBP increases.
Trade Flows
  • Trade flows are the buying and selling of goods and services between foreign producers and foreign buyers. Trade flows measure net exports (exports – imports). This is the amount of goods that one country sellsto other countries minus the amount of goods that a country buys from other countries. This calculationincludes all international transactions and represents a country's trade balance.
  • Countries that are net exporters export more to international clients than they import from international producers. Net exporters run a trade surplus. This is due to the fact that they sell more goods to the international market than they purchase from the international market. Demand for that country's currency then increases because international clients must buy this currency in order to buy these goods. This causes the value of a country's currency to rise.
  • Countries that are net importers import more from international producers than they export to international clients. Net importers run a trade deficit. This is due to the fact that they purchase more foreign goods than they sell to the international market. In order to purchase these international goods, importers must sell their domestic currency and buy a foreign currency. This causes the value of the domestic currency to fall. As an example, let us look at Japan, which is an export driven economy with a trade surplus. Japan exports more goods to international clients than they import from international producers.
  • Japan's trade surplus is the major reason why the JYP has not depreciated sharply despite severe economic weakness.
  • They are a net exporter with a current account surplus of 3% of GDP.
  • This creates international demand to buy JPY in order for international clients to purchase Japanese products.
Clearly a change in the balance of payments from one country to another has a direct effect on currency levels. Therefore, it is important for traders to keep abreast of economic data relating to this balance and understand the implications of changes in the balance of payments.

Trade Flows vs. Capital Flows:
  • Trade flows occur at a relatively slow pace.
  • Capital flows occur almost instantaneously.
Because the international purchase and sale of goods and services is a slow process, the effects that trade has on the FX market takes a much longer time to manifest. Therefore, economic data that involves trade flows should generally be considered for long term trading because it provides a more fundamental…

Capital, on the other hand, is highly mobile. A transfer from your bank account to a bank account in a foreign country can take place with the click of a button. Because of the speed at which these transfers take place, capital flows have a much more direct and explicit effect on the FX market. Traders should consider information concerning growth in equity and bond markets of a country as immediately applicable to the FX market. Success in other markets indicates whether or not capital will flow in or out of a country, which has an effect on domestic currency in a shorter term.

E. The Carry Trade
Carry Trades: An Opportunity to Profit from International Changes in Supply and Demand
The carry trade, also known as interest rate arbitrage, is popular method for trading foreign exchange. However, as with all transactions, carry trades do entail some risk. The chances of losses are great if you do not understand how, why, and when carry trades work best.

How Do Carry Trades Work?
  • A carry trade involves buying a currency that offers a high interest rate while selling a currency that offers a low interest rate.
  • The trader is able to profit from the discrepancy in interest rates by holding the higher interest bearing currency.
Carry trades can be profitable because an investor is able to earn the difference in interest between two currencies when long the higher interest bearing currency of a pair.
Assume that the Australian dollar offers an interest rate of 4.75%, while the Swiss franc offers an interest rate of 0.25%. In this scenario, a trader would buy AUD and sell the CHF. In doing so, he can earn a profit of 4.50% (4.75% - 0.25%), provided the exchange rate between AUD and CHF does not change.

Why Do Carry Trades Work?
  • Interest rates are one of the main ways countries attract foreign investment. Carry trades work because of the constant movement of capital into and out of countries. Interest rates are one of the primary attractions to certain currencies and elicit significant foreign investment. If a country's economy is doing well (high growth, high productivity, low unemployment, rising incomes, etc.), it will be able to offer those who invest in the country a higher return.
  • Profit seeking investors are naturally attracted to the highest rate of returns.
  • Rate of returns in foreign exchange are directly tied to the interest rate on currencies. When making a decision to invest in a particular currency, an investor is more likely than not to choose the one that offers the highest rate of return, or interest rate. If many investors make this exact same decision, the country will experience an inflow of capital.
  • This difference between countries that offer high interest rates and countries that offer low interest rates is what makes carry trades possible.
  • Imagine an investor in Switzerland who is earning an interest rate of 0.25% per year on her bank deposit of Swiss francs. At the same time, a bank in Australia is offering 4.75% per year on a deposit of Australian dollars. Seeing that interest rates are much higher with the Australian bank, this investor would like to find a way to earn this higher rate of interest on her money.
Now imagine that the investor could somehow trade her deposit of Swiss francs paying 0.25% for a deposit of Australian dollars paying 4.75%. What she has effectively done is “sold” her Swiss francs deposit, and “bought” Australian dollars. After this transaction she now owns an Australian dollar deposit that pays her 4.75% in interest per year, 4.50% more than she was earning with her Swiss franc deposit. In essence, this investor has just done a carry trade by “buying” an Australian dollar deposit and “selling” a Swiss franc deposit.

In this scenario:
  • Many investors make the same transaction, exchanging CHF for AUD.
  • Capital flows out of Switzerland and into Australia.
  • Australia attracts more capital because it offers a higher interest rate.
  • This inflow of capital increases the value of AUD.
When Will a Carry Trade Work Best?
  • Carry Trades are most successful when the majority of investors are willing to take on risk.
  • When investors are willing to take on risk, capital flows into high interest bearing currencies.
Things to Bear in Mind When Considering a Carry Trade
  • A carry trade allows an investor to profit from interest rate differentials.
  • Carry trades also involve assuming the risk of the appreciation of the currency the investor has sold.
By entering into a carry trade, an investor is able to earn a profit from the interest rate difference, or spread, between a high interest rate currency and a low interest rate currency. However, the carry trade can turn unprofitable if for some reason the lower interest rate currency appreciates by a large amount.

An ideal carry trade will involve a low interest currency whose economy is weak and has low expectations for growth. However, if the economy were to improve, the country might be able to offer investors a higher rate of return through increased interest rates.
  • Taking the previous example of Switzerland, investors would take advantage of increasing interest rates by buying Swiss francs.
  • This would cause the Swiss franc to appreciate, and would negatively affect the profitability of success of the AUD/CHF carry trade.
  • The higher interest rates in Switzerland would decrease the interest rate spread.
This same sequence of events may currently be unfolding for the Japanese yen. Given its nearly zero interest rates, the Japanese yen has, for quite some time, been an ideal low interest rate currency to use in yen carry trades. However, this situation may be changing as increased optimism about the Japanese economy has recently led to an increase in the Japanese stock market. Increased investor demand for Japanese stocks and currency has caused the yen to appreciate, and this yen appreciation negatively affects the profitability of carry trades like AUD/JPY.

Trade balances
  • Trade balances affect the profitability of the carry trade.
  • Even if a country has a low interest rate, it can still attract investment for the purposes of debt financing.
  • This investment can cause the low interest rate currency to appreciate.
Country trade balances, or the difference between imports and exports, can also affect the profitability of a carry trade. We have shown above that when investors have low risk aversion, capital will flow from the low interest rate paying currency to the high interest rate paying currency. However, this does not always happen.

For example, think about the situation in the United States. The US currently pays historically low interest rates, yet it attracts investment from other countries, even when investors have low risk aversion. This occurs because the US runs a huge trade deficit, meaning the value of its imports are greater than the value if its exports, and this deficit must be financed by other countries. Regardless of the interest rates it offers, the US attracts capital flows for this purpose of deficit financing.

Time-horizon:
Carry trades are long-term commitments.
Before entering into a carry trade, an investor should be willing to commit to a time-horizon of at least six months. This commitment helps to make sure that the trade will not be affected by the “noise” of shorter-term currency price movements.
Summing up, carry trade investors should be aware of relevant factors such as currency appreciation, trade balances, and time-horizon before placing a trade. Any or all of these factors can cause a seemingly profitable carry trade to be unprofitable.

F. Sample Carry Trades
A carry trade is a strategy involving borrowing a currency with a lower interest rate in order to purchase another currency with a higher interest rate. The trader will pay interest at a lower rate for the borrowed currency than he/she will earn on the currency being purchased. This results in the client earning funds due to a positive interest rate differential between the two currencies in the trade.

AUD/USD Monthly
On 09/01/01, the situation in the United States is worrisome. The economy is officially in a recession and geopolitical pressures threaten to weaken the economy even further. The Fed decides to spur growth by aggressively cutting rates. Rates in the US will then decrease from above 4% to 1%. The spread between Australian rates and US rates widens. International bond investors shift their funds to the highest yields and accumulate in Australian Bonds. They need to buy Australian dollars and the AUD/USD increases from the 0.5000 level to the current 0.7000 level. They pocket the 3% interest differential on the bonds for 2 years and the 40% increase in the currency over the same period.


USD/CAD Monthly
Let's look at the same situation, this time using the USD/CAD pair as an example. The Fed decides to spur growth by aggressively cutting rates. Rates in the US then decrease from above 4% to 1%. The spread between Canadian rates and US rates goes from negative to positive. Canadian investors repatriate their funds from the US since they can invest at home and get better returns. Soon enough, US investors realize that they can simply invest across the border and get higher returns. The Loonie rallies and the USDCAD pair falls from 1.6000 to 1.3000. Carry trade investors profit from the interest rate differential, as well as the ensuing downtrend in USDCAD.


Read More..... »»
 
StoplossForex is proudly powered by Blogger.com